Background
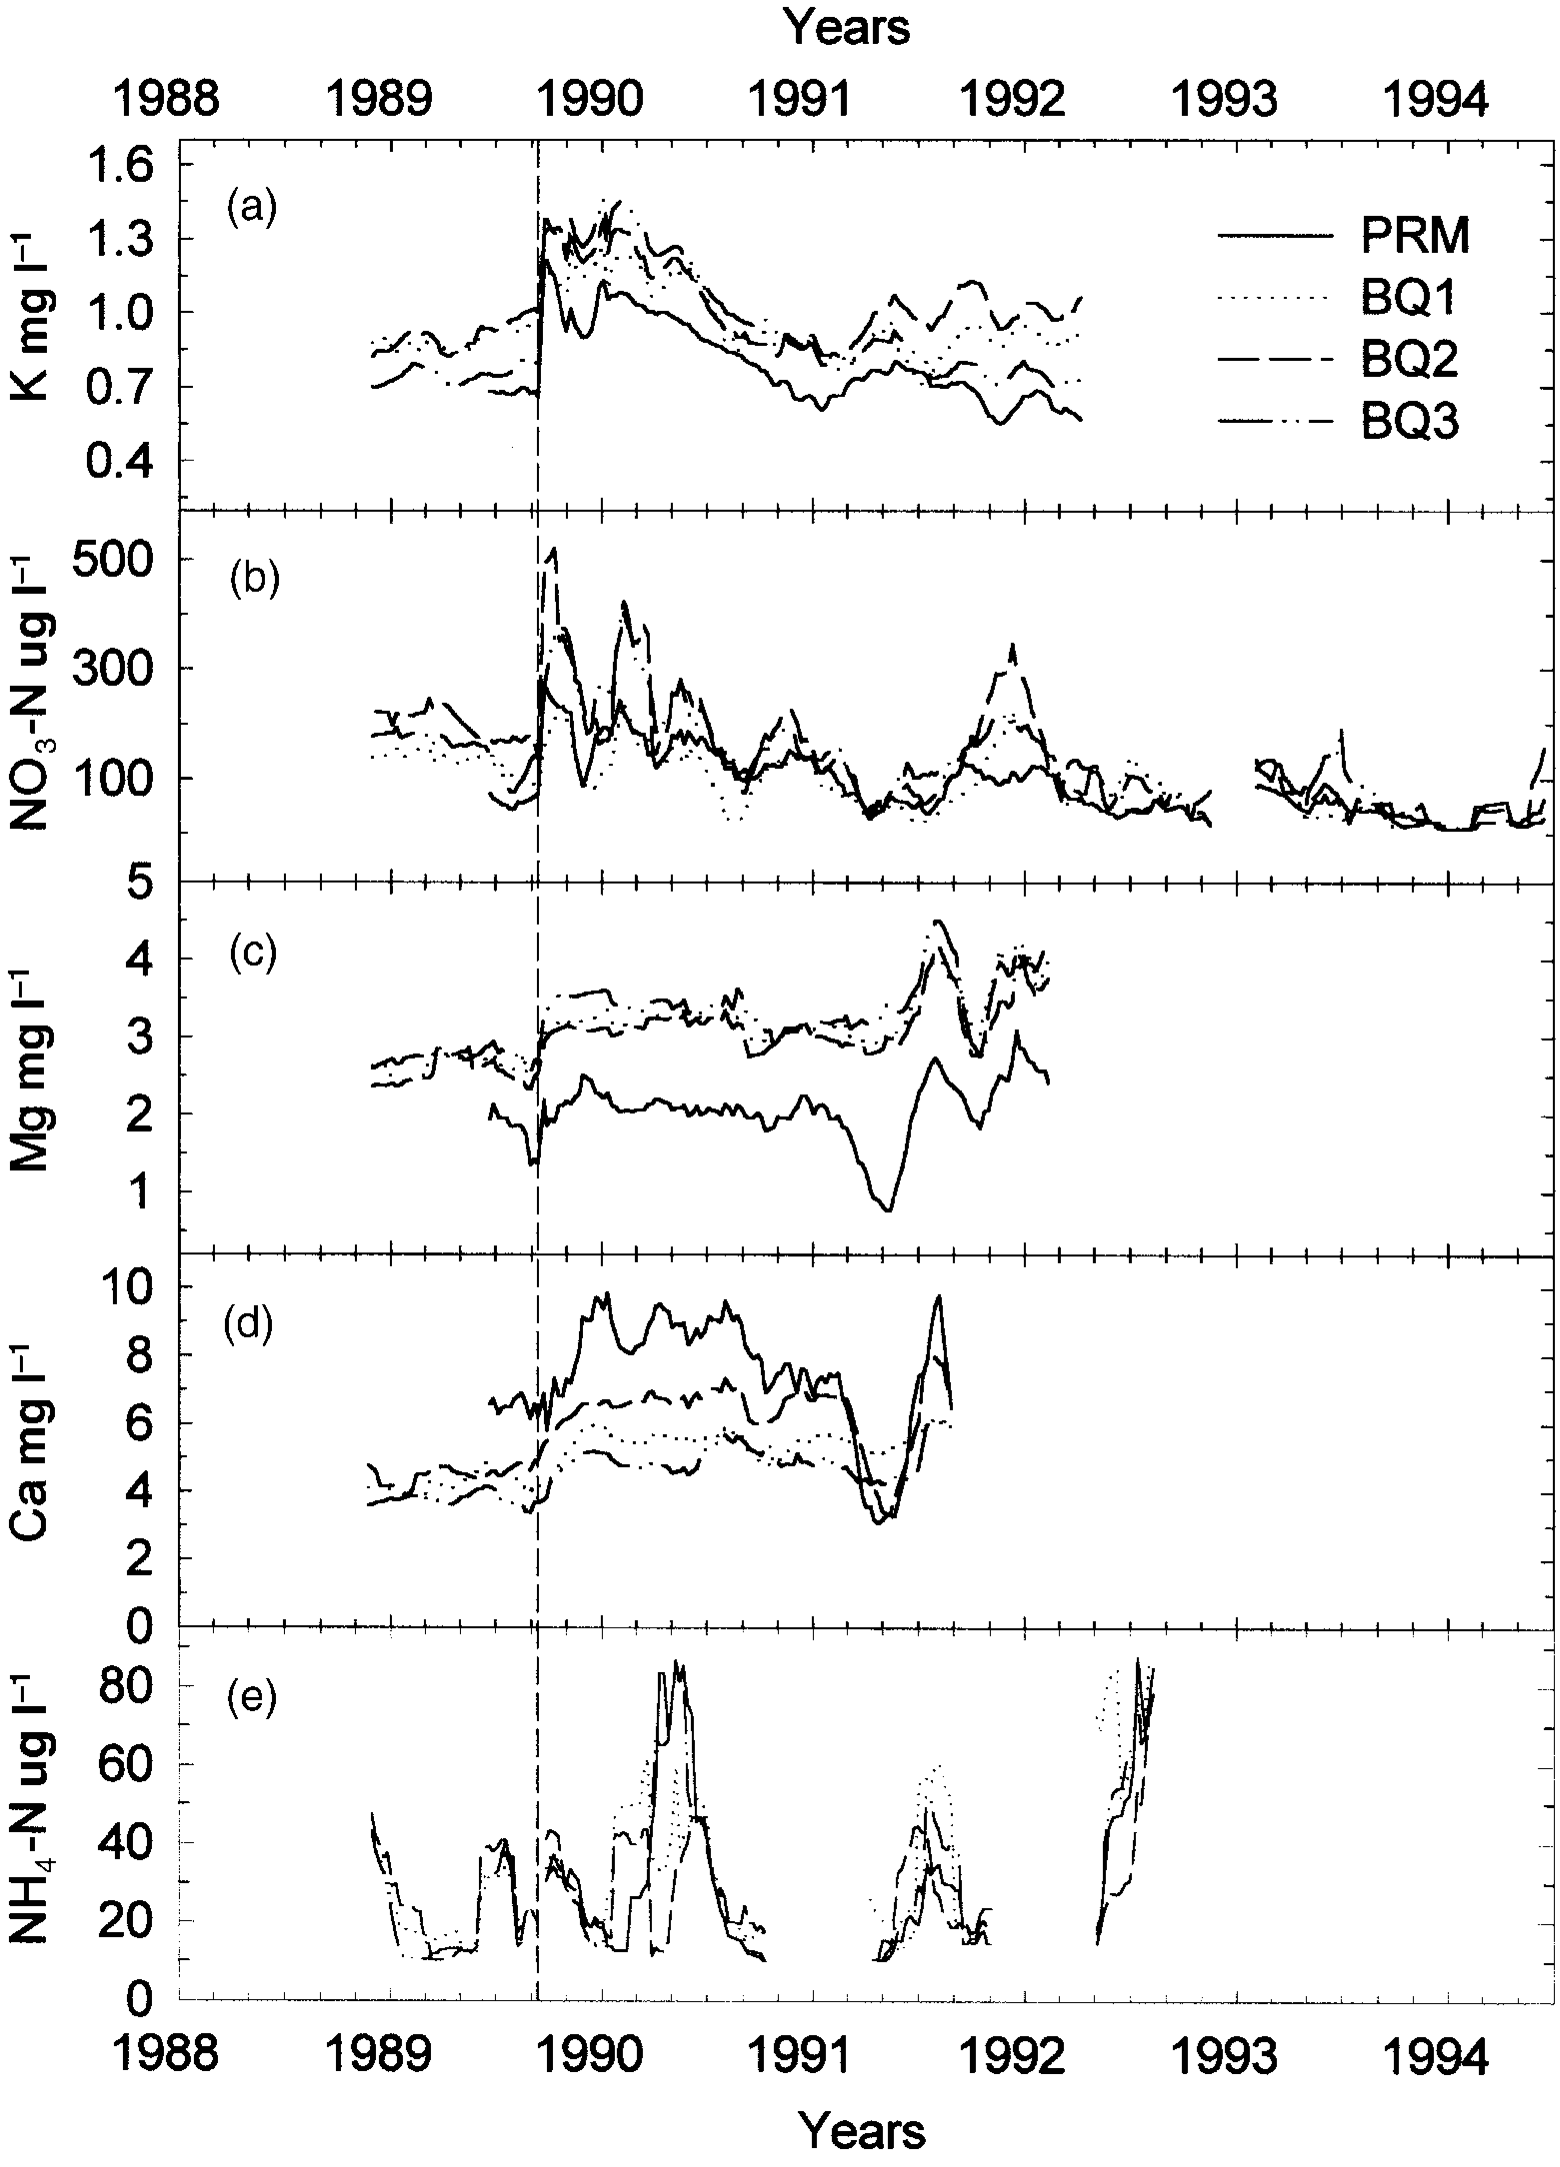
What happens to water quality after a hurricane hits? Schaefer et al. (2000) investigated long-term stream water quality in Puerto Rico before and after the 1989 Hurricane Hugo. They found that some nutrients, like potassium, increased greatly post-disturbance and stayed elevated for years afterwards.
Goals
Over the course of this week, you’re going to reproduce figure 3 from Schaefer et al. (2000). Your goal for today is to gather the data, make an analysis plan, and write the code to process and visualize the data. By the end of the week, you will organize your analysis and document your workflow. Even better, you’ll do it collaboratively and prepare it to run on a high-performance cluster.
Data
The data are available through the Environmental Data Initiative. You can find them here: (McDowell and International Institute Of Tropical Forestry (IITF) 2024).
Instructions
Setup
- Create a new RStudio project.
- Create a GitHub repo.
- Download the data from McDowell and International Institute Of Tropical Forestry (IITF) (2024) and put it in your project folder.
- Make an initial commit and push to GitHub.
Explore
- Examine figure 3 of Schaefer et al. (2000) and the data available at McDowell and International Institute Of Tropical Forestry (IITF) (2024).
- Make a list of the data files and the columns within them that you think you’ll need to reproduce figure 3.
It may be helpful to read a CSV file into R and explore it using numeric or visual summaries.
Plan
- Based on the caption of figure 3, write down the steps you think will be necessary to reproduce figure 3.
- Create a flow chart of how the steps fit together. Things to consider include:
- How will you get the data into R?
- How will you clean up the data?
- Are any processing or modeling steps required?
- What are your outputs?